NCVO has launched the 15th edition of the UK Civil Society Almanac, once again providing a comprehensive overview of facts and figures related to the voluntary sector.
NCVO principally use charities’ accounts to estimate the sector’s finances, as well as survey data to understand rates of volunteering and the sector’s workforce.
A blog by Jennifer Crees, Research Officer at NCVO, highlights the top 10 findings from this year’s edition (http://blogs.ncvo.org.uk/2016/04/11/almanac-2016-the-latest-data-on-the-voluntary-sector/).
Top 10 findings
1. There has been a sharp rise in youth volunteering
In 2014/15, 35% of 16-25 year olds reported volunteering at least once per month, up from 31% in 2013/14.
2. The voluntary sector paid workforce rose once again to 827,000 in 2015
For comparison, this is more than two and half times the workforce of Tesco (the UK’s largest private sector employer) and just over half that of the NHS (the UK’s largest public sector employer).
3. The value of the UK voluntary sector to the wider economy was £12.2bn in 2013/14
This is calculated as its gross value added (GVA) and was comparable to the nominal GDP of Iceland.
4. The number of charities with an income over £100m increased from 33 to 40 in 2013/14
Due to their combined contribution in terms of income to the sector we have separated these into a new income band called ‘super-major’. All this year’s analyses now include this new category.
5. There was a small increase in income to the sector this year, now standing at £43.8bn
However, mirroring our findings in our Navigating Change report, this varied according to size of organisation. The higher the income band, the greater the rise in income between 2012/13 and 2013/14, with super-major charities increasing their share by nearly £1.7bn.

6. Income from government increased slightly, by around £0.5bn
This change occurred in the context of an increase in government departmental spending in 13/14. It also followed significant cuts earlier in the spending review period. The vast majority of this (£447m) was received by super-major charities in the form of large contracts and grants.
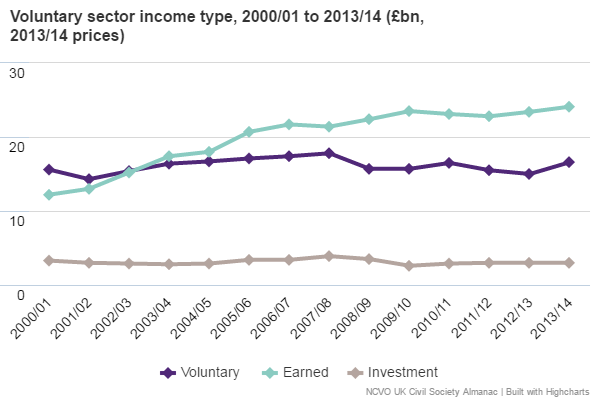
7. The sector continued to earn most of its income
Income from providing goods and services (also known as earned income) remained higher than income from donations and grants (voluntary income), indicating a continuing shift in the way that charities generate their income.
8. Total spending for the sector rose slightly to £41.7bn
Overall, voluntary sector spending was highest from social services charities, partly as these are more numerous, but research charities spent the most on average.
9. Grant-making by the voluntary sector increased in 2013/14 to £5.3bn
This was alongside a general rise in spending. However, grant making has not returned to its 2007/08 peak of £6.1bn.
10. The voluntary sector’s assets are disproportionately held by a small number of large organisations
In 2013/14 the sector’s net assets were worth £105.1bn, with half of this (£52bn) held by just 100 organisations.
For further information and to view the full data, visit: https://data.ncvo.org.uk/